2019 was the very first year that I tracked my reading using a Google Sheet!
While I’m thrilled to be able to check out all of these amazing charts and results from my reading, I’m even more excited to track my reading again next year to watch how things change over time.
The template that I used was create by Brock Roberts. After stumbling across this amazing template, I decided to hide a few of the columns that I personally wasn’t interested in tracking. Even so, that left me with a TON of stats!
Let’s dive in!
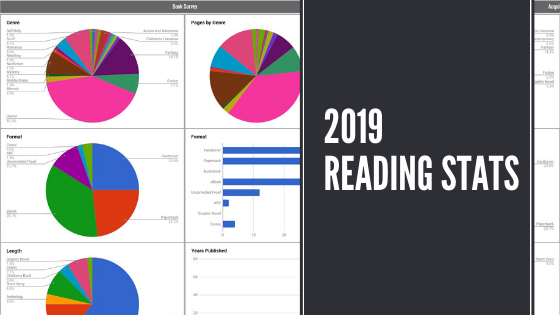
My 2019 Book Survey

I’m sure seeing that I read 41.4% horror isn’t much of a surprise to anyone! This is definitely my preferred genre. The genres I was surprised by were Fantasy and Romance; I wasn’t aware I read that much in those categories.
The category I would like to see increase in 2020 is definitely Non-Fiction and Self Help.

From this chart, I learned that I would like to break out the ARC’s and Uncorrected Proofs. For 2020, I will have:
- ARC – Digital
- ARC – Physical
- Uncorrected Proof – Digital
- Uncorrected Proof – Physical

Seeing how many digital books that I read this year helps justify my interest in upgrading my Paperwhite to the Kindle Fire! Thanks again to Kevin J. Kennedy for recommending that I look into the Kindle Fire! 🙂

Page length is an interesting one to me! I know that I have been avoiding some of the longer books on my TBR. I’m hoping to finally dive into some of those longer books in 2020.

Remember when I said I wanted to do a bit of re-reading? HA! Total fail here in 2019… The only books I re-read were children’s books… We’ll see how 2020 plays out.

I LOVE the books by month and pages by month charts! I’m amazed to see which months we’re better reading-wise, and which I struggled with. It definitely lines up with the craziness that occurred in my professional and personal life.
While I was still able to read A LOT in 2019, it certainly wasn’t as much as I hoped to read. In 2020, I’m making “me time” more of a priority.


I love the years published chart as well! I really focused in on reading a lot of books as they were releases to stay current. Doing my “Books I Can’t Wait To Read” posts have helped with that. I’m also glad to see I still read plenty from my backlist.

This is definitely the most colorful chart on my reading tracker! I LOVE seeing how big the Self publishing section is. And of course KJK Publishing came in second!

I totally failed in figuring out how to remove the half ratings… But MAN! Look at those high ratings! To check out the list of all my 5-star reads, click here!
Acquisitions
In 2019, I acquired 87 books total, spending a total of $434.71. However, I saved $778.70 through book sales, using the library, and receiving books for free!

I love seeing this breakdown by source, but it does make me very sad that I’m no longer part of BOTM. Hopefully I will be able to join again someday!

This…. This chart is incredible. Major thanks to everyone that sent a book my way! <3
Thanks for reading!
What stats do you track year over year? Are there any stats you’d be interested in seeing me track in 2020?
If you’ve created a post like this, I would love to take a look! Feel free to add your links below!
I LOVE stat posts! A big yes to horror being your most popular genre! Behind horror, my second biggest category this year was non fiction and that should continue this year as I have lots of NF to read! I can see a few categories that I might add to my own pie charts in my December roundup ie format, physical and digital, rating and page length! Or maybe I’ll do a second set of pie charts to cover that! I always do genre, author gender, fiction and non fiction, series and stand-alone and this year I did a monster tracker just for fun!
😀 That’s so awesome!! I have so many non-fiction books on my shelf that I need to get to. I LOVE the idea of a monster tracker!! Happy 2020! 🙂
I tracked my reading for the first time this year too. It was a bit of work but it did make some of my wrap up posts (like my holiday buying guide) a little easier. And it was interesting to see what I read more in-depth.
<3 I love it! My tracking definitely made my wrap-up easier as well!
Wow, so detailed! I generally only track number of books read by month and then type of book based on the challenges I do!
I’m a bit of a nerd for stats! 🙂
I love seeing stats like this! Looks like you had an amazing bookish year!
<3
This is an awesome idea! I’m such a nerd when it comes to stats. And lest be honest all other things. 😂
<3 <3
Wow this is so interesting! I’m starting to track my stats this year. I hope it turns out like yours!
I definitely recommend the spreadsheet that I used from Brock Roberts if you want one that you don’t have to do all of the formulas for! 🙂
I love this post! I used a spreadsheet that gave me quite a few graphs too, but in the end, I decided not to use them. I will have to check out Brock’s spreadsheet. It’s way more involved than the one I did. Thank you for sharing!
Thank you! 🙂 I LOVE his spreadsheet! Just make sure to only hide things you don’t want to track if you do use the sheet. Deleting things breaks the formulas.
I have graph envy! This is fantastic and you’ve definitely inspired me to do more with my reading stats in 2020!
<3 <3
Oh gosh, this looks so cool. All the pie charts 😍 And hooray for saving almost $800. We read mostly library books, and last year we saved over $2,000 (and that was just starting when the library upgraded their system in December). I think I want to try this for myself for 2020. I imagine it will be 90% picture books though, haha!
That’s AMAZING!! What a savings! Thank goodness for libraries! 🙂
I don’t keep track of these stats, but I love seeing posts about them! That’s awesome you’re still reading plenty of backlist books.
<3
So cool to see stats like this!
<3
I agree that comparing your stats from year to year is really fun. Now you have a great place to start! Thanks for sharing your 2019 reading with us!
😀 Thanks for taking a look!! 🙂